Monitoring
The HTTP server in Routinator provides endpoints for monitoring the application. This means it may be a good idea to run the HTTP server alongside the RTR server.
To launch Routinator in server mode on 192.0.2.13 with RTR running on port 3323 and HTTP on 9556, use the following command:
routinator server --rtr 192.0.2.13:3323 --http 192.0.2.13:9556
The HTTP service has three monitoring endpoints on the following paths:
- /version
- Returns the version of the Routinator instance
- /metrics
- Exposes a data format specifically for Prometheus, for which dedicated port 9556 is reserved.
- /status
- Returns the information from the
/metricsendpoint in a more concise format
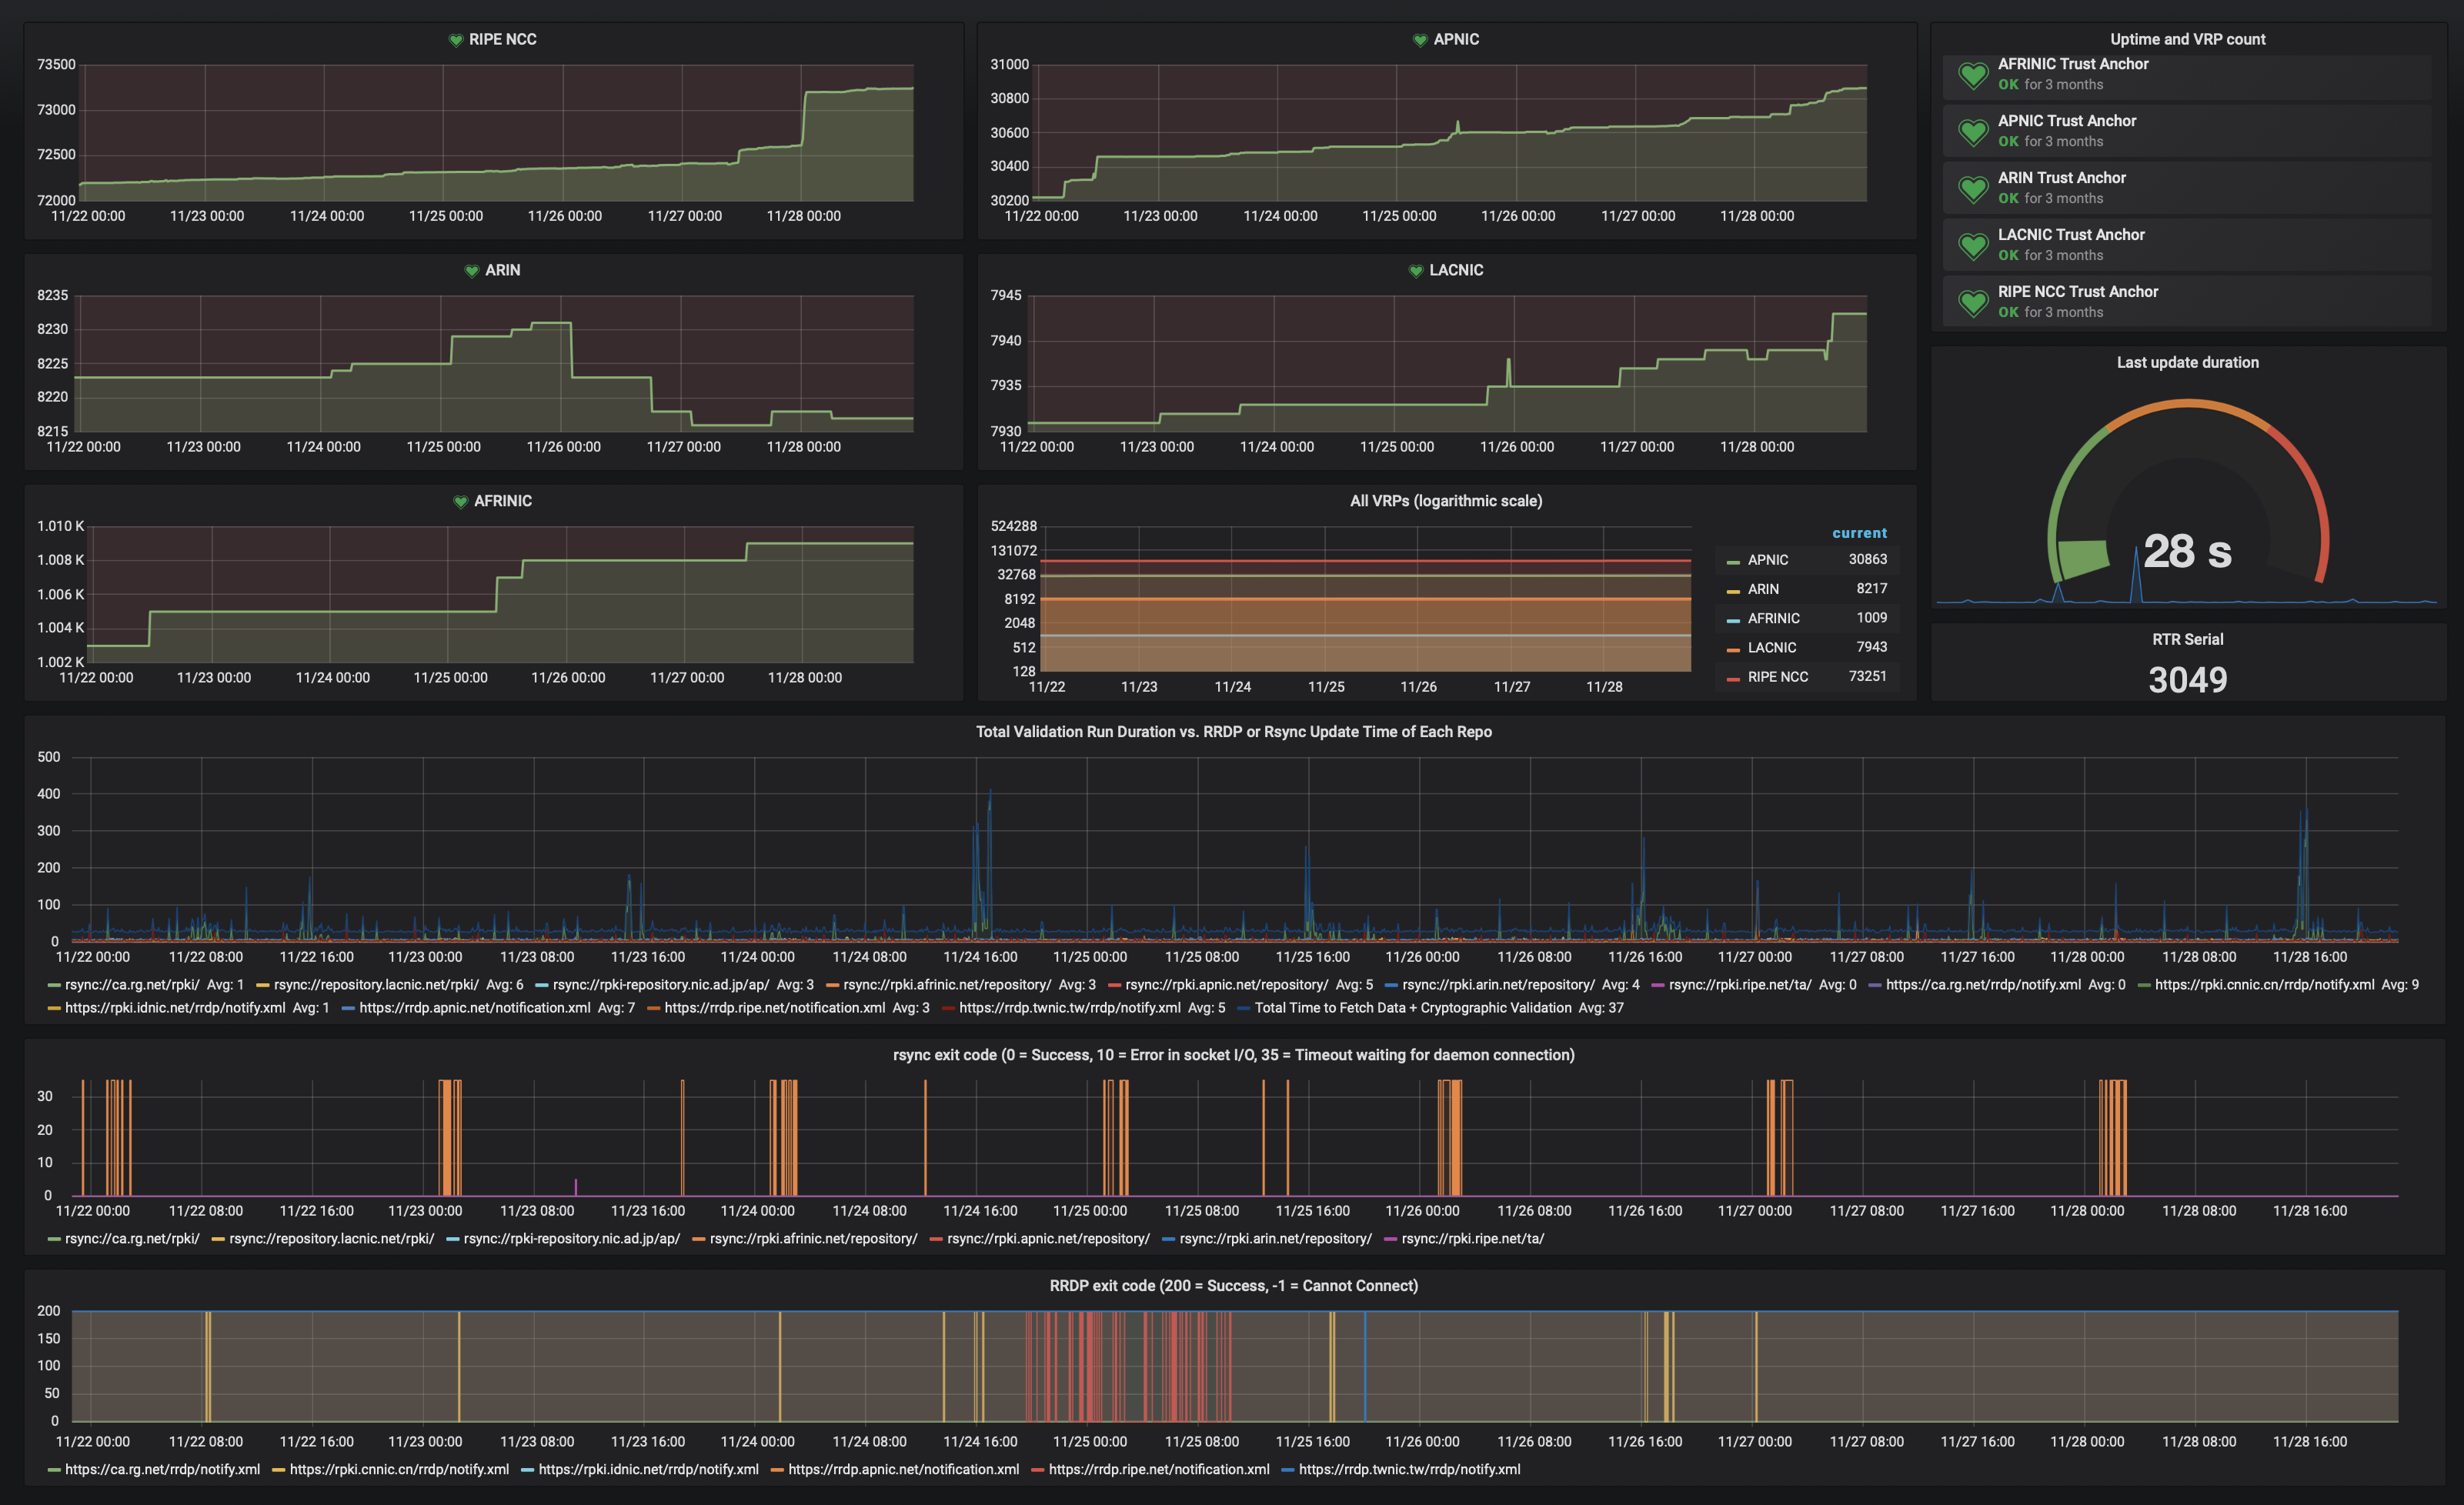
Metrics
- Update metrics
- When the last update started and finished
- The total duration of the last update
- The retrieval duration and exit code for each rsync publication point
- The retrieval duration and HTTP status code for each RRDP publication point
- Object metrics
- The number of valid ROAs per Trust Anchor
- The number of Validated ROA Payloads (VRPs) per Trust Anchor
- The number of stale objects found
- RTR server
- The current RTR serial number
- The current and total number of RTR connections
- The total amount of bytes sent and received over the RTR connection
- HTTP server
- The current and total number of HTTP connections
- The total amount of bytes sent and received over the HTTP connection
- The number of HTTP requests